IntelliSense for jQuery in WebMatrix
28 June 2013 • by Bob • Scripting, WebMatrix
I recently had the opportunity to take a day-long class about jQuery from the good folks at Wintellect. The class went great, and I wrote all of my code for the class in WebMatrix. You might recall from my previous blogs that I am a big fan of WebMatrix, but at first there was one thing that was missing from WebMatrix's arsenal of cool features; in order for WebMatrix to really be useful as an editor for jQuery, I really wanted to have IntelliSense support for jQuery. Thankfully, even though IntelliSense support for jQuery is not built-in, adding IntelliSense for jQuery is extremely easy, and I thought that would make a great subject for today's blog.
To start things off, let's take a look at a jQuery sample that is little more than a Hello World sample:
<!DOCTYPE html>
<html lang="en">
    <head>
        <meta charset="utf-8" />
        <title>jQuery Test Page</title>
    </head>
    <body>
        <script src="http://ajax.microsoft.com/ajax/jQuery/jquery-2.0.0.min.js" type="text/javascript"></script>
        <script>
        $(function() {
           $("#bar").text($("#foo").text());
           $("#foo").text("This is some custom text");
        });
        </script>
        <h1 id="foo">This is the first line</h1>
        <h2 id="bar">This is the second line</h2>
    </body>
</html>
This example does very little: it loads the jQuery library from Microsoft's AJAX Content Delivery Network (CDN), and it uses jQuery to replace the text in a couple of HTML tags. (The example isn't really important - getting IntelliSense to work is the topic du jour.) This sample would look like the following illustration if you opened it in WebMatrix 3:
When you are using a JavaScript library for which there is no built-in support, Microsoft's developer tools allow you to add IntelliSense support by adding Reference Directives to your page, and the files that you would use for your reference directives are available at the same Microsoft CDN where you can get the jQuery library:
http://www.asp.net/ajaxlibrary/cdn.ashx
In order to use IntelliSense for jQuery, you need to download the appropriate jquery-n.n.n-vsdoc.js file for the version of jQuery that you are using and store that in your website. For example, if you are using jQuery version 2.0.0, you would add a script reference to the CDN path for http://ajax.aspnetcdn.com/ajax/jQuery/jquery-2.0.0.min.js, and you would download the http://ajax.aspnetcdn.com/ajax/jQuery/jquery-2.0.0-vsdoc.js file for your website.
Like many developers, I usually add a folder named scripts in the root of my website, and this is where I will typically store the jquery-n.n.n-vsdoc.js file that I am using. Once you have added the appropriate jquery-n.n.n-vsdoc.js file to your website, all that you need to do is add the appropriate reference directive to your script, as I demonstrate in the highlighted section of the following code sample:
<!DOCTYPE html>
<html lang="en">
    <head>
        <meta charset="utf-8" />
        <title>jQuery Test Page</title>
    </head>
    <body>
        <script src="http://ajax.microsoft.com/ajax/jQuery/jquery-2.0.0.min.js" type="text/javascript"></script>
        <script>
        /// <reference path="scripts/jquery-2.0.0-vsdoc.js" />
        $(function() {
           $("#bar").text($("#foo").text());
           $("#foo").text("This is some custom text");
        });
        </script>
        <h1 id="foo">This is the first line</h1>
        <h2 id="bar">This is the second line</h2>
    </body>
</html>
Once you have added the reference directive for your jquery-n.n.n-vsdoc.js file, IntelliSense will begin working for jQuery in WebMatrix, as shown in the following illustration:
In Closing...
One last thing that I would like to mention is that is always a good idea to load JavaScript libraries like jQuery from a CDN, and there are lots of CDNs to choose from. There are some additional steps that you can take to ensure that your website works with jQuery even if the CDN is down, but that subject is outside the scope of this blog. ;-]
Note: This blog was originally posted at http://blogs.msdn.com/robert_mcmurray/
Advanced Log Parser Charts Part 5 - Creating a Generic Chart Color Script
25 August 2012 • by Bob • LogParser, Scripting
In Part 5 of this series, I'll show you how to create a generic script that you can use to add some color to your Log Parser charts. As I mentioned in Part 1 of this series, the default colors for Log parser charts are really dull and boring. For example, if I parse one month's worth of log files from one of my low-volume websites with the following query:
logparser.exe "SELECT date,COUNT(*) AS Hits INTO HITS.gif FROM *.log GROUP BY date ORDER BY date" -i:w3c -o:CHART -chartType:ColumnClustered -chartTitle:"" -q:ON
Log Parser will create the following ugly daily hits chart:
Generic Color Change Script
Here's the background story for this blog: I have a collection of scripts that I use to format my charts, several of which have faithfully served as the fodder for this blog series. With that in mind, I had a situation recently where I was querying logs with a series of data just like this, and of course the resulting charts were kind of hideous to look at. In one of the scripts that I often use, I create an array of colors to use, and then I apply the various colors to the individual data points in the series.
In the past I have always hard-coded the length for the array of colors based on the data that I am working with, but in this situation I had no idea how many data points I would have, so I decided to put together a quick script with an array that would work with a series of any size.
Here's the resulting script:
// Set a default color for the chart's data.
chart.SeriesCollection(0).Interior.Color = "#ffcccc";

// Define a short array of colors.
var colors = [
    "#ffff99", "#ff99ff", "#ff9999",
    "#99ffff", "#99ff99", "#9999ff",
    "#ffffcc", "#ffccff", "#ffcccc",
    "#ccffff", "#ccffcc", "#ccccff"
];

// Loop through the data points in the series.
for (x=0;x<chart.SeriesCollection(0).Points.Count;++x)
{
    // Set the color for the data point based on modulo division of the array length.
    chart.SeriesCollection(0).Points(x).Interior.Color = colors[x % colors.length ];
}
That's all that there is to the script - it's pretty simple. If I take the above script and save it as "FormatChart.js", I can use that script with my Log Parser query from earlier by adding an extra parameter to the command:
logparser.exe "SELECT date,COUNT(*) AS Hits INTO HITS.gif FROM *.log GROUP BY date ORDER BY date" -i:w3c -o:CHART -chartType:ColumnClustered -chartTitle:"" -q:ON -config:FormatChart.js
Now Log Parser will create the following daily hits chart with a great deal more color to it:
Okay - perhaps that's not the best color palette, but you get the idea. It looks even better when I change the query to use 3D charts:
logparser.exe "SELECT date,COUNT(*) AS Hits INTO HITS.gif FROM *.log GROUP BY date ORDER BY date" -i:w3c -o:CHART -chartType:Column3D -chartTitle:"" -q:ON -config:FormatChart.js
The above query creates the following chart:
Color Changing Pie Charts
I'd like to make a quick change to the script in order to make it work a little better with a pie chart:
// Set a default color for the chart's data.
chart.SeriesCollection(0).Interior.Color = "#cccccc";

// Define a short array of colors.
var colors = [
    "#cc3333", "#3333cc", "#33cc33",
    "#33cccc", "#cccc33", "#cc33cc"
];

// Loop through the data points in the series.
for (x=0;x<chart.SeriesCollection(0).Points.Count;++x)
{
    // Set the color for the data point based on modulo division of the array length.
    chart.SeriesCollection(0).Points(x).Interior.Color = colors[x % colors.length ];
}
// Rotate the chart 180 degrees - just so it looks a little better.
chartSpace.Charts(0).PlotArea.RotateClockwise();
chartSpace.Charts(0).PlotArea.RotateClockwise();
For this query I'd like to see a break down by HTTP status, and this necessitates some small change to the Log parser query:
logparser.exe "SELECT sc-status AS Status,COUNT(*) AS Hits INTO HITS.gif FROM *.log GROUP BY Status ORDER BY Status" -i:w3c -o:CHART -chartType:PieExploded3D -chartTitle:"" -q:ON -config:FormatChart.js
The above query creates the following chart:
Summary
That wraps it up for this blog - I hope that I've given you some ideas for ways that you can easily add some colors to some dull-looking Log Parser charts.
Note: This blog was originally posted at http://blogs.msdn.com/robert_mcmurray/
Programmatically Flushing FTP Logs
03 February 2012 • by Bob • IIS, Scripting, FTP, Extensibility
I had a great question from Scott Forsyth earlier today about programmatically flushing the logs for an FTP site. Scott had noticed that there was a FlushLog method listed on the following page in the IIS Configuration Reference:
http://www.iis.net/ConfigReference/system.applicationHost/sites/site/ftpServer
Unfortunately there wasn't a code sample for that method; but as luck would have it, I had already written some code to do just that. (I love synchronicity...) With that in mind, I though that I'd post the code in a blog. In keeping with the cross-language samples that I wrote for the topics in the Configuration Reference, I thought that's I'd include several languages in this blog to make it easier for someone else to copy and paste.
C#
using System;
using System.Text;
using Microsoft.Web.Administration;

internal static class Sample
{
   private static void Main()
   {
      using (ServerManager serverManager = new ServerManager())
      {
         Configuration config = serverManager.GetApplicationHostConfiguration();
         // Retrieve the sites collection.
         ConfigurationSection sitesSection = config.GetSection("system.applicationHost/sites");
         ConfigurationElementCollection sitesCollection = sitesSection.GetCollection();

         // Locate a specific site.
         ConfigurationElement siteElement = FindElement(sitesCollection,"site","name",@"ftp.contoso.com");
         if (siteElement == null) throw new InvalidOperationException("Element not found!");

         // Create an object for the ftpServer element.
         ConfigurationElement ftpServerElement = siteElement.GetChildElement("ftpServer");
         // Create an instance of the FlushLog method.
         ConfigurationMethodInstance FlushLog = ftpServerElement.Methods["FlushLog"].CreateInstance();
         // Execute the method to flush the logs for the FTP site.
         FlushLog.Execute();
      }
   }

   // Locate and return the index for a specific element in a collection.
   private static ConfigurationElement FindElement(ConfigurationElementCollection collection, string elementTagName, params string[] keyValues)
   {
      foreach (ConfigurationElement element in collection)
      {
         if (String.Equals(element.ElementTagName, elementTagName, StringComparison.OrdinalIgnoreCase))
         {
            bool matches = true;
            for (int i = 0; i < keyValues.Length; i += 2)
            {
               object o = element.GetAttributeValue(keyValues[i]);
               string value = null;
               if (o != null)
               {
                  value = o.ToString();
               }
               if (!String.Equals(value, keyValues[i + 1], StringComparison.OrdinalIgnoreCase))
               {         matches = false;
                  break;
               }
            }
            if (matches)
            {
               return element;
            }
         }
      }
      return null;
   }
}
VB.NET
Imports System
Imports System.Text
Imports Microsoft.Web.Administration

Module Sample
   Sub Main()
      Dim serverManager As ServerManager = New ServerManager
      Dim config As Configuration = serverManager.GetApplicationHostConfiguration
      ' Retrieve the sites collection.
      Dim sitesSection As ConfigurationSection = config.GetSection("system.applicationHost/sites")
      Dim sitesCollection As ConfigurationElementCollection = sitesSection.GetCollection

      ' Locate a specific site.
      Dim siteElement As ConfigurationElement = FindElement(sitesCollection,"site","name","ftp.contoso.com")
      If (siteElement Is Nothing) Then
         Throw New InvalidOperationException("Element not found!")
      End If

      ' Create an object for the ftpServer element.
      Dim ftpServerElement As ConfigurationElement = siteElement.GetChildElement("ftpServer")
      ' Create an instance of the FlushLog method.
      Dim FlushLog As ConfigurationMethodInstance = ftpServerElement.Methods("FlushLog").CreateInstance()
      ' Execute the method to flush the logs for the FTP site.
      FlushLog.Execute()

   End Sub

   ' Locate and return the index for a specific element in a collection.
   Private Function FindElement(ByVal collection As ConfigurationElementCollection, ByVal elementTagName As String, ByVal ParamArray keyValues() As String) As ConfigurationElement
      For Each element As ConfigurationElement In collection
         If String.Equals(element.ElementTagName, elementTagName, StringComparison.OrdinalIgnoreCase) Then
            Dim matches As Boolean = True
            Dim i As Integer
            For i = 0 To keyValues.Length - 1 Step 2
               Dim o As Object = element.GetAttributeValue(keyValues(i))
               Dim value As String = Nothing
               If (Not (o) Is Nothing) Then
                  value = o.ToString
               End If
               If Not String.Equals(value, keyValues((i + 1)), StringComparison.OrdinalIgnoreCase) Then
                  matches = False
                  Exit For
               End If
            Next
            If matches Then
               Return element
            End If
         End If
      Next
      Return Nothing
   End Function

End Module
JavaScript
// Create a Writable Admin Manager object.
var adminManager = new ActiveXObject('Microsoft.ApplicationHost.WritableAdminManager');
adminManager.CommitPath = "MACHINE/WEBROOT/APPHOST";

// Retrieve the sites collection.
var sitesSection = adminManager.GetAdminSection("system.applicationHost/sites","MACHINE/WEBROOT/APPHOST");
var sitesCollection = sitesSection.Collection;

// Locate a specific site.
var siteElementPos = FindElement(sitesCollection,"site",["name","ftp.contoso.com"]);
if (siteElementPos == -1) throw "Element not found!";

// Retrieve the site element.
var siteElement = sitesCollection.Item(siteElementPos);
// Create an object for the ftpServer element.
var ftpServerElement = siteElement.ChildElements.Item("ftpServer");
// Create an instance of the FlushLog method.
var FlushLog = ftpServerElement.Methods.Item("FlushLog").CreateInstance();
// Execute the method to flush the logs for the FTP site.
FlushLog.Execute();

// Locate and return the index for a specific element in a collection.
function FindElement(collection, elementTagName, valuesToMatch) {
   for (var i = 0; i < collection.Count; i++) {
      var element = collection.Item(i);
      if (element.Name == elementTagName) {
         var matches = true;
         for (var iVal = 0; iVal < valuesToMatch.length; iVal += 2) {
            var property = element.GetPropertyByName(valuesToMatch[iVal]);
            var value = property.Value;
            if (value != null) {
               value = value.toString();
            }
            if (value != valuesToMatch[iVal + 1]) {
               matches = false;
               break;
            }
         }
         if (matches) {
            return i;
         }
      }
   }
   return -1;
}
VBScript
' Create a Writable Admin Manager object.
Set adminManager = CreateObject("Microsoft.ApplicationHost.WritableAdminManager")
adminManager.CommitPath = "MACHINE/WEBROOT/APPHOST"

' Retrieve the sites collection.
Set sitesSection = adminManager.GetAdminSection("system.applicationHost/sites","MACHINE/WEBROOT/APPHOST")
Set sitesCollection = sitesSection.Collection

' Locate a specific site.
siteElementPos = FindElement(sitesCollection,"site",Array("name","ftp.contoso.com"))
If siteElementPos = -1 Then
   WScript.Echo "Element not found!"
   WScript.Quit
End If

' Retrieve the site element.
Set siteElement = sitesCollection.Item(siteElementPos)
' Create an object for the ftpServer element.
Set ftpServerElement = siteElement.ChildElements.Item("ftpServer")
' Create an instance of the FlushLog method.
Set FlushLog = ftpServerElement.Methods.Item("FlushLog").CreateInstance()
' Execute the method to flush the logs for the FTP site.
FlushLog.Execute()

' Locate and return the index for a specific element in a collection.
Function FindElement(collection, elementTagName, valuesToMatch)
   For i = 0 To CInt(collection.Count) - 1
      Set element = collection.Item(i)
      If element.Name = elementTagName Then
         matches = True
         For iVal = 0 To UBound(valuesToMatch) Step 2
            Set property = element.GetPropertyByName(valuesToMatch(iVal))
            value = property.Value
            If Not IsNull(value) Then
               value = CStr(value)
            End If
            If Not value = CStr(valuesToMatch(iVal + 1)) Then
               matches = False
               Exit For
            End If
         Next
         If matches Then
            Exit For
         End If
      End If
   Next
   If matches Then
      FindElement = i
   Else
      FindElement = -1   End If
End Function
Summary
Hopefully this gives you an idea of how to call the FlushLog method. You can also use these examples to call the Start and Stop methods for FTP sites; you just need to substitute the correct method in place of the FlushLog method.
Note: This blog was originally posted at http://blogs.msdn.com/robert_mcmurray/
Using URL Rewrite to Insert Different Scripts Based on Browser Type
03 February 2012 • by Bob • IIS, Scripting
I just stumbled across a piece of sample code that I had written several months ago for a coworker, and I thought that I'd share it with everyone.
Here's the scenario: my coworker asked me if it was possible to have different client-side scripts inserted dynamically depending on the type of web browser that is being used. If the application was written in ASP.NET or some other dynamic language, then it would be trivial to determine the browser type and return the correct HTML <script> block to the client. Unfortunately, he needed the script for both static and dynamic pages, and he didn't want to modify all of his pages unless absolutely necessary.
This sounded to me like a job for a pair of outbound rules in URL Rewrite.
With the above design requirements in mind, I wrote the following sample configuration for URL Rewrite that accomplishes the following tasks:
- If you’re using Internet Explorer, it inserts VBScript to display a popup message.
- If you’re not using Internet Explorer, it inserts JavaScript to display a different popup message.
In order to use this sample code, you need to open the web.config file for your application and add the following code for the URL Rewrite rules. (Note: You need to disable compression in order to avoid an HTTP 500.52 error, and the following sample code does just that.)
<system.webServer>
<rewrite>
<outboundRules>
<rule name="Add JavaScript" preCondition="IsNotInternetExplorer" patternSyntax="ExactMatch">
<match filterByTags="None" pattern="</body>" />
<action type="Rewrite" value="<script language="javascript">alert('You are not using Internet Explorer!');</script></body>" />
</rule>
<rule name="Add VBScript" preCondition="IsInternetExplorer" patternSyntax="ExactMatch">
<match filterByTags="None" pattern="</body>" />
<action type="Rewrite" value="<script language="vbscript">MsgBox "You are using Internet Explorer!"</script></body>" />
</rule>
<preConditions>
<preCondition name="IsInternetExplorer">
<add input="{RESPONSE_CONTENT_TYPE}" pattern="^text/html" />
<add input="{HTTP_USER_AGENT}" pattern=".*MSIE" negate="false" />
</preCondition>
<preCondition name="IsNotInternetExplorer">
<add input="{RESPONSE_CONTENT_TYPE}" pattern="^text/html" />
<add input="{HTTP_USER_AGENT}" pattern=".*MSIE" negate="true" />
</preCondition>
</preConditions>
</outboundRules>
</rewrite>
<urlCompression doStaticCompression="false" doDynamicCompression="false" />
</system.webServer>
The above example is what I sent to my coworker, and I intended it as an easy place to start when you just want a simple chunk of script to be inserted. It works well, but a better example would be to have it dynamically insert code for an external script file based on the browser type. This is illustrated in the following example:
<system.webServer>
<rewrite>
<outboundRules>
<rule name="For Other Browsers" preCondition="IsNotInternetExplorer" patternSyntax="ExactMatch">
<match filterByTags="None" pattern="</body>" />
<action type="Rewrite" value="<script language="javascript" src="other.js"></script></body>" />
</rule>
<rule name="For Internet Explorer" preCondition="IsInternetExplorer" patternSyntax="ExactMatch">
<match filterByTags="None" pattern="</body>" />
<action type="Rewrite" value="<script language="javascript" src="msie.js"></script></body>" />
</rule>
<preConditions>
<preCondition name="IsInternetExplorer">
<add input="{RESPONSE_CONTENT_TYPE}" pattern="^text/html" />
<add input="{HTTP_USER_AGENT}" pattern=".*MSIE" negate="false" />
</preCondition>
<preCondition name="IsNotInternetExplorer">
<add input="{RESPONSE_CONTENT_TYPE}" pattern="^text/html" />
<add input="{HTTP_USER_AGENT}" pattern=".*MSIE" negate="true" />
</preCondition>
</preConditions>
</outboundRules>
</rewrite>
<urlCompression doStaticCompression="false" doDynamicCompression="false" />
</system.webServer>
The above sample dynamically inserts an HTML <script> block, and specifies one script file ("msie.js") for Internet Explorer a different script file ("other.js") for all other browsers.
A simple script for a simple task - just the way I like it. ;-]
Note: This blog was originally posted at http://blogs.msdn.com/robert_mcmurray/
Advanced Log Parser Charts Part 2 - Using Gradient Colors for Area Charts
29 January 2012 • by Bob • IIS, LogParser, Scripting
In Part 2 of this series, I'll show you how to customize the area chart from Part 1 to show the chart area with a gradient. More specifically, there are three different chart gradient methods that we'll take a look at in this blog post:
Before I continue, there is one quick Log Parser convention that you should realize: there are two objects that Log Parser will create and pass to your script. As you look at the sample scripts in this post, you will see these objects in use:
| Object Name | Description | Example |
|---|---|---|
chartSpace |
This is the base chart workspace object. |
// Set the border style for the chart. |
chart |
This is equivalent to the chartSpace.Charts(0) object. |
// Change the background color. |
Before I get started, here's a quick review of VBScript that uses Log Parser COM objects:
Option Explicit
' Declare the variables.
Dim objLogQuery, strSQL
Dim objInputW3CFormat, objOutputChartFormat
' Create the Log Parser objects.
Set objLogQuery = WScript.CreateObject("MSUtil.LogQuery")
Set objInputW3CFormat = WScript.CreateObject("MSUtil.LogQuery.W3CInputFormat")
Set objOutputChartFormat = WScript.CreateObject("MSUtil.LogQuery.ChartOutputFormat")
' Define the SQL query.
strSQL = "SELECT Date, COUNT(*) AS Hits " & _
" INTO _Part2.gif " & _
" FROM *.log " & _
" GROUP BY Date " & _
" ORDER BY Date"
' Specify the chart options.
objOutputChartFormat.groupSize = "800x600"
objOutputChartFormat.fileType = "GIF"
objOutputChartFormat.chartType = "Area"
objOutputChartFormat.categories = "ON"
objOutputChartFormat.values = "ON"
objOutputChartFormat.legend = "OFF"
' Execute the SQL statement to create the chart.
objLogQuery.ExecuteBatch strSQL, objInputW3CFormat, objOutputChartFormat
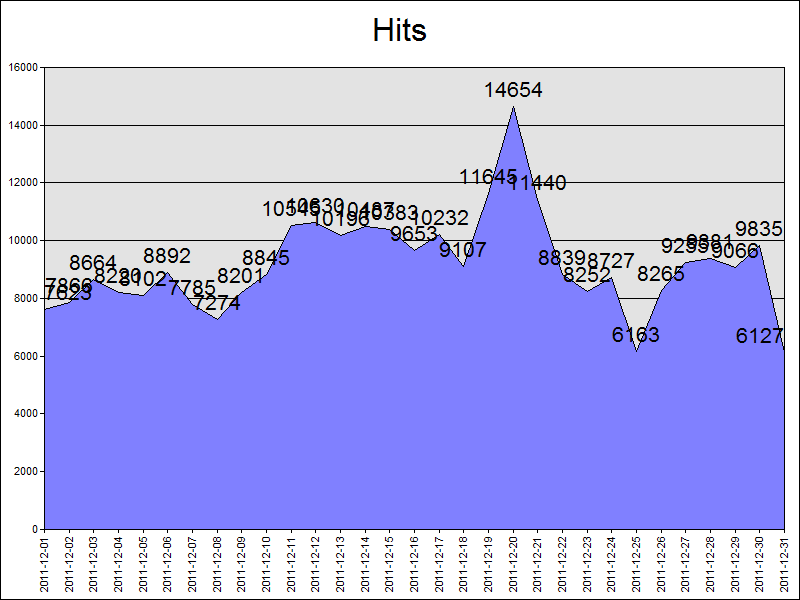
As I mentioned in Part 1 of this series, you don't have to use the COM objects, but I chose to do so for this blog series because it makes it a little easier to script. That being said, if I use one month's worth of log files from one of my low-volume websites, Log Parser and this VBScript creates the following rather ugly daily hits chart:
With all of this in mind, let's take a look at some simple configuration scripts.
Setting Fonts and Titles and Such...
The above chart really needs some help, so the first thing that we'll do is change a few things. First things first, we need to specify the name of the chart configuration script in the VBScript sample:
Option Explicit
' Declare the variables.
Dim objLogQuery, strSQL
Dim objInputW3CFormat, objOutputChartFormat
' Create the Log Parser objects.
Set objLogQuery = WScript.CreateObject("MSUtil.LogQuery")
Set objInputW3CFormat = WScript.CreateObject("MSUtil.LogQuery.W3CInputFormat")
Set objOutputChartFormat = WScript.CreateObject("MSUtil.LogQuery.ChartOutputFormat")
' Define the SQL query.
strSQL = "SELECT Date, COUNT(*) AS Hits " & _
" INTO Part2.gif " & _
" FROM *.log " & _
" GROUP BY Date " & _
" ORDER BY Date"
' Specify the chart options.
objOutputChartFormat.groupSize = "800x600"
objOutputChartFormat.fileType = "GIF"
objOutputChartFormat.chartType = "Area"
objOutputChartFormat.categories = "ON"
objOutputChartFormat.values = "ON"
objOutputChartFormat.legend = "OFF"
objOutputChartFormat.config = "Part2.js"
' Execute the SQL statement to create the chart.
objLogQuery.ExecuteBatch strSQL, objInputW3CFormat, objOutputChartFormat
Next, we need to create the actual chart configuration script, which I wrote in JavaScript; you will need to save this as "Part2.js" in order to use my samples:
// Set the title above the chart.
chart.HasTitle = true;
chart.Title.Caption = "Hits by Day"
// Set the border style for the chart.
chartSpace.Border.Color = "#000000";
chartSpace.Border.Weight = 2;
// Change the background color for the plot area.
chart.PlotArea.Interior.Color = "#f0f0f0";
// Set the font size for the chart values.
chart.SeriesCollection(0).DataLabelsCollection(0).Font.Size = 6;
// Get the start and end dates from the X axis.
var startDate = chart.Axes(0).CategoryLabels.Item(0).Caption;
var endDate = chart.Axes(0).CategoryLabels.Item(chart.Axes(0).CategoryLabels.ItemCount-1).Caption;
// Set the caption below the chart.
chartSpace.HasChartSpaceTitle = true;
chartSpace.ChartSpaceTitle.Caption =
"This chart shows the hits by day from "
+ startDate + " to " + endDate + ".";
chartSpace.ChartSpaceTitle.Font.Size = 10;
chartSpace.ChartSpaceTitle.Position = chartSpace.Constants.chTitlePositionBottom;
// Set the style and caption for the Y axis.
chart.Axes(0).Font.Size = 8;
chart.Axes(0).HasTitle = true;
chart.Axes(0).Title.Caption = "Dates";
chart.Axes(0).Title.Font.Size = 9;
// Set the style and caption for the X axis.
chart.Axes(1).Font.Size = 7;
chart.Axes(1).HasTitle = true;
chart.Axes(1).Title.Caption = "Hits";
chart.Axes(1).Title.Font.Size = 9;
This chart configuration script does several things:
- Sets the title above the chart to "Hits by Day"
- Sets a black border style for the chart
- Sets the background color for the plot area to a light gray
- Sets the font size for the chart values to 6-point
- Sets the caption below the chart for the start and end date
- Sets the font styles and captions for the Y and Y axes
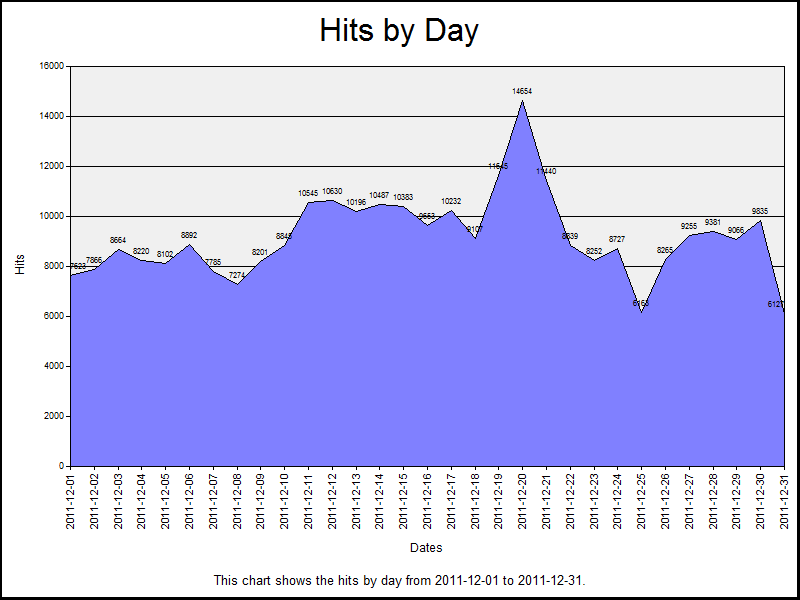
When you run the VBScript, the resulting chart looks like the following:
This looks a little more legible, but now let's look at setting some colors.
Setting a One-Color Gradient
Using the same JavaScript sample from earlier, we just need to make a couple of changes to the chart configuration script in order to use the SetOneColorGradient method:
// Set the title above the chart.
chart.HasTitle = true;
chart.Title.Caption = "Hits by Day"

// Set the border style for the chart.
chartSpace.Border.Color = "#000000";
chartSpace.Border.Weight = 2;

// Change the background color for the plot area.
chart.PlotArea.Interior.Color = "#f0f0f0";

// Specify the chart gradient styles.
chart.SeriesCollection(0).Interior.SetOneColorGradient(
 chartSpace.Constants.chGradientHorizontal,
 chartSpace.Constants.chGradientVariantEnd,
 1.0,
 "#ff0000");

// Set the font size for the chart values.
chart.SeriesCollection(0).DataLabelsCollection(0).Font.Size = 6;

// Get the start and end dates from the X axis.
var startDate = chart.Axes(0).CategoryLabels.Item(0).Caption;
var endDate = chart.Axes(0).CategoryLabels.Item(chart.Axes(0).CategoryLabels.ItemCount-1).Caption;

// Set the caption below the chart.
chartSpace.HasChartSpaceTitle = true;
chartSpace.ChartSpaceTitle.Caption =
    "This chart shows the hits by day from "
    + startDate + " to " + endDate + ".";
chartSpace.ChartSpaceTitle.Font.Size = 10;
chartSpace.ChartSpaceTitle.Position = chartSpace.Constants.chTitlePositionBottom;

// Set the style and caption for the Y axis.
chart.Axes(0).Font.Size = 8;
chart.Axes(0).HasTitle = true;
chart.Axes(0).Title.Caption = "Dates";
chart.Axes(0).Title.Font.Size = 9;

// Set the style and caption for the X axis.
chart.Axes(1).Font.Size = 7;
chart.Axes(1).HasTitle = true;
chart.Axes(1).Title.Caption = "Hits";
chart.Axes(1).Title.Font.Size = 9;
When you run the VBScript, this renders a chart that looks like the following:
There are four parameters for the SetOneColorGradient method to look at:
| Parameter | Description |
|---|---|
GradientStyle |
This is a value from the ChartGradientStyleEnum enumeration, which specifies how the gradient will be displayed. For example: horizontally, vertically, diagonally, etc. |
GradientVariant |
This is a value from the ChartGradientVariantEnum enumeration, which specifies which direction the gradient will be displayed. For example: lighter to darker, from the inside to the outside, etc. |
GradientDegree |
This is a double value from 0.0 to 1.0, which specifies whether the gradient will range from the color to lighter or darker shades. |
Color |
This is a string that specifies the color. This can be a commonly-named color, such as "red," "blue," etc., or this can be an RGB hexadecimal value, such as "#ff0000" (red), "#0000ff" (blue), etc. (See my 216-Color Safe Web Palette blog post for a large series of hexadecimal color values.) |
Let's make some quick changes to parameters that we are passing to the SetOneColorGradient method and alter a few of the colors:
// Set the title above the chart.
chart.HasTitle = true;
chart.Title.Caption = "Hits by Day"

// Set the border style for the chart.
chartSpace.Border.Color = "#000000";
chartSpace.Border.Weight = 2;

// Change the background color for the plot area.
chart.PlotArea.Interior.Color = "#333333";

// Specify the chart gradient styles.
chart.SeriesCollection(0).Interior.SetOneColorGradient(
    chartSpace.Constants.chGradientHorizontal,
    chartSpace.Constants.chGradientVariantStart,
    0.0,
    "#00ff00");

// Set the font size for the chart values.
chart.SeriesCollection(0).DataLabelsCollection(0).Font.Size = 6;
chart.SeriesCollection(0).DataLabelsCollection(0).Font.Color = "#ffffff";

// Get the start and end dates from the X axis.
var startDate = chart.Axes(0).CategoryLabels.Item(0).Caption;
var endDate = chart.Axes(0).CategoryLabels.Item(chart.Axes(0).CategoryLabels.ItemCount-1).Caption;

// Set the caption below the chart.
chartSpace.HasChartSpaceTitle = true;
chartSpace.ChartSpaceTitle.Caption =
    "This chart shows the hits by day from "
    + startDate + " to " + endDate + ".";
chartSpace.ChartSpaceTitle.Font.Size = 10;
chartSpace.ChartSpaceTitle.Position = chartSpace.Constants.chTitlePositionBottom;

// Set the style and caption for the Y axis.
chart.Axes(0).Font.Size = 8;
chart.Axes(0).HasTitle = true;
chart.Axes(0).Title.Caption = "Dates";
chart.Axes(0).Title.Font.Size = 9;

// Set the style and caption for the X axis.
chart.Axes(1).Font.Size = 7;
chart.Axes(1).HasTitle = true;
chart.Axes(1).Title.Caption = "Hits";
chart.Axes(1).Title.Font.Size = 9;
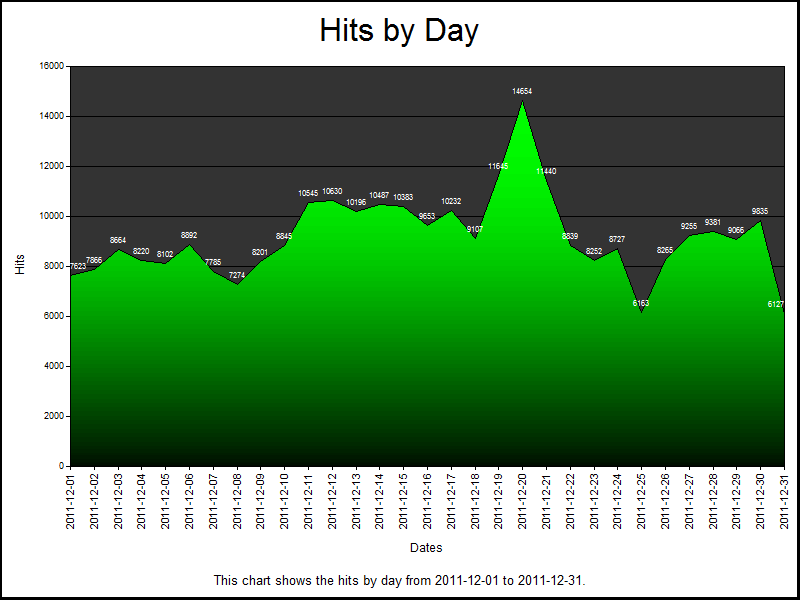
When you run the VBScript, that results in the following considerably cooler-looking chart:
Setting a Two-Color Gradient
The SetTwoColorGradient method offers more color flexibility than the one-color gradient method, and we only need to make a couple of changes to the JavaScript for the chart configuration script in order to use the new method:
// Set the title above the chart.
chart.HasTitle = true;
chart.Title.Caption = "Hits by Day"

// Set the border style for the chart.
chartSpace.Border.Color = "#000000";
chartSpace.Border.Weight = 2;

// Change the background color for the plot area.
chart.PlotArea.Interior.Color = "#FFFF99";

// Specify the chart gradient styles.
chart.SeriesCollection(0).Interior.SetTwoColorGradient(
 chartSpace.Constants.chGradientVertical,
 chartSpace.Constants.chGradientVariantStart,
 "#0066FF",
 "#00FFCC");

// Set the font size for the chart values.
chart.SeriesCollection(0).DataLabelsCollection(0).Font.Size = 6;

// Get the start and end dates from the X axis.
var startDate = chart.Axes(0).CategoryLabels.Item(0).Caption;
var endDate = chart.Axes(0).CategoryLabels.Item(chart.Axes(0).CategoryLabels.ItemCount-1).Caption;

// Set the caption below the chart.
chartSpace.HasChartSpaceTitle = true;
chartSpace.ChartSpaceTitle.Caption =
    "This chart shows the hits by day from "
    + startDate + " to " + endDate + ".";
chartSpace.ChartSpaceTitle.Font.Size = 10;
chartSpace.ChartSpaceTitle.Position = chartSpace.Constants.chTitlePositionBottom;

// Set the style and caption for the Y axis.
chart.Axes(0).Font.Size = 8;
chart.Axes(0).HasTitle = true;
chart.Axes(0).Title.Caption = "Dates";
chart.Axes(0).Title.Font.Size = 9;

// Set the style and caption for the X axis.
chart.Axes(1).Font.Size = 7;
chart.Axes(1).HasTitle = true;
chart.Axes(1).Title.Caption = "Hits";
chart.Axes(1).Title.Font.Size = 9;
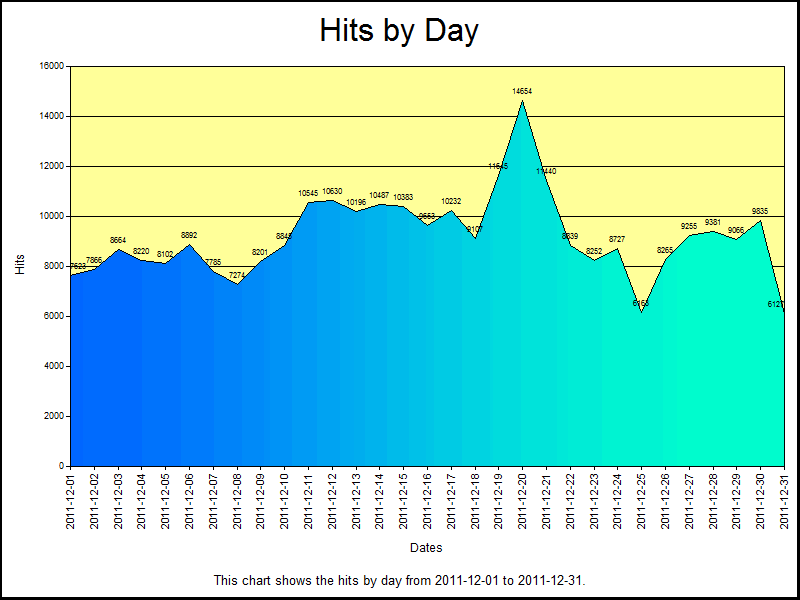
When you run the VBScript, this will create the following chart:
There are four parameters for the SetTwoColorGradient method to consider:
| Parameter | Description |
|---|---|
GradientStyle |
This is a value from the ChartGradientStyleEnum enumeration, which specifies how the gradient will be displayed. For example: horizontally, vertically, diagonally, etc. |
GradientVariant |
This is a value from the ChartGradientVariantEnum enumeration, which specifies which direction the gradient will be displayed. For example: lighter to darker, from the inside to the outside, etc. |
Color |
This is a string that specifies the first color for the gradient; this can be a commonly-named color, such as "red," "blue," etc., or this can be an RGB hexadecimal value, such as "#ff0000" (red), "#0000ff" (blue), etc. (See my 216-Color Safe Web Palette blog post for a large series of hexadecimal color values.) |
BackColor |
This is a string that specifies the second color for the gradient; this can be a value like the Color parameter. |
Using a Preset Gradient
There is an additional gradient method that uses a collection of preset color palettes; this method is appropriately named SetPresetGradient. Once again, we need to make a couple of changes to the JavaScript for the chart configuration script in order to use the new method:
// Set the title above the chart.
chart.HasTitle = true;
chart.Title.Caption = "Hits by Day"

// Set the border style for the chart.
chartSpace.Border.Color = "#000000";
chartSpace.Border.Weight = 2;

// Change the background color for the plot area.
chart.PlotArea.Interior.Color = "#EEFFDD";

// Specify the chart gradient styles.
chart.SeriesCollection(0).Interior.SetPresetGradient(
 chartSpace.Constants.chGradientHorizontal,
 chartSpace.Constants.chGradientVariantStart,
 chartSpace.Constants.chGradientFire);

// Set the font size for the chart values.
chart.SeriesCollection(0).DataLabelsCollection(0).Font.Size = 6;

// Get the start and end dates from the X axis.
var startDate = chart.Axes(0).CategoryLabels.Item(0).Caption;
var endDate = chart.Axes(0).CategoryLabels.Item(chart.Axes(0).CategoryLabels.ItemCount-1).Caption;

// Set the caption below the chart.
chartSpace.HasChartSpaceTitle = true;
chartSpace.ChartSpaceTitle.Caption =
    "This chart shows the hits by day from "
    + startDate + " to " + endDate + ".";
chartSpace.ChartSpaceTitle.Font.Size = 10;
chartSpace.ChartSpaceTitle.Position = chartSpace.Constants.chTitlePositionBottom;

// Set the style and caption for the Y axis.
chart.Axes(0).Font.Size = 8;
chart.Axes(0).HasTitle = true;
chart.Axes(0).Title.Caption = "Dates";
chart.Axes(0).Title.Font.Size = 9;

// Set the style and caption for the X axis.
chart.Axes(1).Font.Size = 7;
chart.Axes(1).HasTitle = true;
chart.Axes(1).Title.Caption = "Hits";
chart.Axes(1).Title.Font.Size = 9;
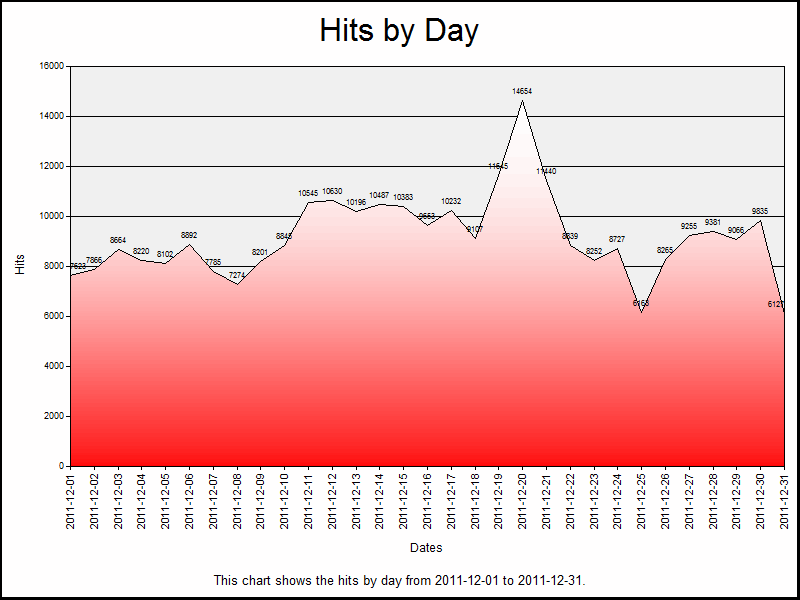
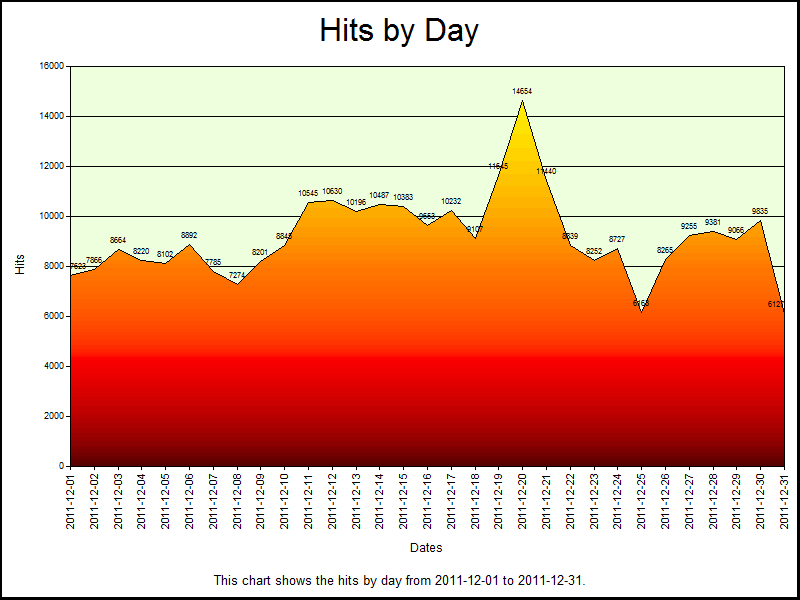
When you run the VBScript, this will create the following chart:
There are three parameters for the SetPresetGradient method to look at:
| Parameter | Description |
|---|---|
GradientStyle |
This is a value from the ChartGradientStyleEnum enumeration, which specifies how the gradient will be displayed. For example: horizontally, vertically, diagonally, etc. |
GradientVariant |
This is a value from the ChartGradientVariantEnum enumeration, which specifies which direction the gradient will be displayed. For example: lighter to darker, from the inside to the outside, etc. |
GradientPreset |
This is a value from the ChartPresetGradientTypeEnum enumeration, which specifies the gradient preset palette. |
There are several of preset gradients in the ChartPresetGradientTypeEnum enumeration, and a little experimentation will yield the best results.
Using 3-D Area Charts
For one last sample, I'd like to show you what gradients can do for your 3-D area charts. To do so, we first need to make a couple of small changes the VBScript that will create the chart:
Option Explicit

' Declare the variables.
Dim objLogQuery, strSQL
Dim objInputW3CFormat, objOutputChartFormat

' Create the Log Parser objects.
Set objLogQuery = WScript.CreateObject("MSUtil.LogQuery")
Set objInputW3CFormat = WScript.CreateObject("MSUtil.LogQuery.W3CInputFormat")
Set objOutputChartFormat = WScript.CreateObject("MSUtil.LogQuery.ChartOutputFormat")

' Define the SQL query.
strSQL = "SELECT Date, COUNT(*) AS Hits " & _
    " INTO _Part2.gif " & _
    " FROM *.log " & _
    " GROUP BY Date " & _
    " ORDER BY Date"

' Specify the chart options.
objOutputChartFormat.groupSize = "1024x768"
objOutputChartFormat.fileType = "GIF"
objOutputChartFormat.chartType = "Area3D"
objOutputChartFormat.categories = "ON"
objOutputChartFormat.values = "ON"
objOutputChartFormat.legend = "OFF"
objOutputChartFormat.config = "Part2.js"

' Execute the SQL statement to create the chart.
objLogQuery.ExecuteBatch strSQL, objInputW3CFormat, objOutputChartFormat
Next, we need to update the JavaScript for the chart configuration script to work with the new VBScript; for the most part, I'm just updating font sizes and chart colors:
// Set the title above the chart.
chart.HasTitle = true;
chart.Title.Caption = "Hits by Day"

// Clear the caption for the chart series.
chart.SeriesCollection(0).Caption = "";

// Set the border style for the chart.
chartSpace.Border.Color = "#000000";
chartSpace.Border.Weight = 2;

// Change the background color for the plot area.
chart.PlotArea.Interior.Color = "#FFFFCC";

// Specify the chart gradient styles.
chart.SeriesCollection(0).Interior.SetTwoColorGradient(
    chartSpace.Constants.chGradientHorizontal,
    chartSpace.Constants.chGradientVariantEnd,
    "#00CCFF",
    "#FFFFFF");

// Set the font size for the chart values.
chart.SeriesCollection(0).DataLabelsCollection(0).Font.Size = 7;

// Get the start and end dates from the X axis.
var startDate = chart.Axes(0).CategoryLabels.Item(0).Caption;
var endDate = chart.Axes(0).CategoryLabels.Item(chart.Axes(0).CategoryLabels.ItemCount-1).Caption;

// Set the caption below the chart.
chartSpace.HasChartSpaceTitle = true;
chartSpace.ChartSpaceTitle.Caption =
    "This chart shows the hits by day from "
    + startDate + " to " + endDate + ".";
chartSpace.ChartSpaceTitle.Font.Size = 10;
chartSpace.ChartSpaceTitle.Position = chartSpace.Constants.chTitlePositionBottom;

// Set the style and caption for the Y axis.
chart.Axes(0).Font.Size = 10;
chart.Axes(0).HasTitle = true;
chart.Axes(0).Title.Caption = "Dates";
chart.Axes(0).Title.Font.Size = 11;

// Set the style and caption for the X axis.
chart.Axes(1).Font.Size = 9;
chart.Axes(1).HasTitle = true;
chart.Axes(1).Title.Caption = "Hits";
chart.Axes(1).Title.Font.Size = 11;
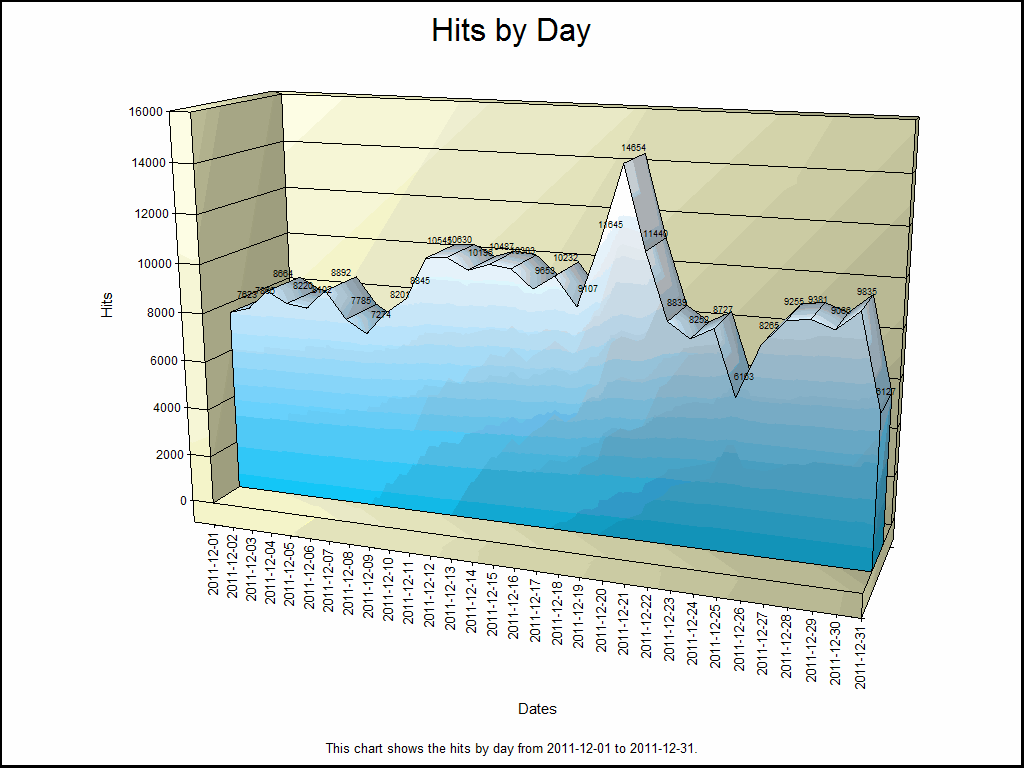
When you run the VBScript, this will create the following chart:
Summary
In this blog post, I've written a lot of code samples in order to show you four different ways to set gradients for your Log Parser area charts. In future posts, I'll show you how to do some more cool things with some other types of charts.
;-]
Note: This blog was originally posted at http://blogs.msdn.com/robert_mcmurray/
Advanced Log Parser Charts Part 1 - Working With Configuration Scripts
28 January 2012 • by Bob • IIS, LogParser, Scripting
I recently had a situation where I wanted to customize the chart output from Log Parser, and after a bunch of research I eventually arrived at the conclusion that configuration scripts to create customized charts are probably the least-documented feature of Log Parser. After a lot of experimentation, (and a bit of frustration), I finally managed to achieve the results that I wanted. With that in mind, I thought that it would make a great blog series if I documented some of the settings that I used.
Log Parser and Chart Configuration Scripts
When you look in the Log Parser help file, it makes mention of using configuration scripts to customize charts, and it provides the following small JavaScript sample:
// Add a caption
chartSpace.HasChartSpaceTitle = true;
chartSpace.ChartSpaceTitle.Caption = "Generated by Log Parser 2.2";
chartSpace.ChartSpaceTitle.Font.Size = 6;
chartSpace.ChartSpaceTitle.Position = chartSpace.Constants.chTitlePositionBottom;

// Change the background color
chart.PlotArea.Interior.Color = chartSpace.Constants.chColorNone;
Unfortunately, this sample isn't very useful, although I found dozens of forum posts that quote this sample as a way to do things - but it's the only sample that most people cite. The Log Parser help file mentions looking at the MSDN ChartSpace Object Model documentation, but that documentation is only slightly more useful. These two references are what led me to my earlier conclusion that chart configuration scripts are not well-documented, and especially when you are trying to do something with Log Parser.
What I found to be particularly helpful was to use the Log Parser COM interface and write scripts by using Adersoft's VbsEdit and JsEdit. In case you haven't used either of those applications, they are great IDEs for writing scripts; they both give you a great debugging environment, and they have a great object browser that I used to discover what options were available to me. In the end, these two editors made it possible to create the chart configuration scripts that I will discuss in this blog series.
By the way, chart configuration scripts can be written in VBScript or JavaScript, but for this blog I will use VBScript for the Log Parser COM samples and JavaScript for the configuration script samples. I didn't have to do it that way, but it seemed like a good idea to help differentiate between the samples.
Using COM versus the Command-Line
For the samples in this blog series, I will use Log Parser's COM interface and VBScript to create my charts, but this is not necessary; everything that I am documenting can be done from the command-line version of Log parser, and I'll give you some quick examples to see the differences.
The following examples generate some simple area charts that plot the total number of hits by day, and both examples do exactly the same thing:
Command-Line:
logparser.exe "
COM Interface:
Option Explicit

Dim objLogQuery, strSQL
Dim objInputW3CFormat, objOutputChartFormat

Set objLogQuery = WScript.CreateObject("MSUtil.LogQuery")
Set objInputW3CFormat = WScript.CreateObject("MSUtil.LogQuery.W3CInputFormat")
Set objOutputChartFormat = WScript.CreateObject("MSUtil.LogQuery.ChartOutputFormat")

strSQL = "SELECT Date, COUNT(*) AS Hits " & _
    " INTO HitsByDay.gif " & _
    " FROM *.log " & _
    " GROUP BY Date " & _
    " ORDER BY Date"

objOutputChartFormat.groupSize = "800x600"
objOutputChartFormat.fileType = "GIF"
objOutputChartFormat.chartType = "Area"
objOutputChartFormat.categories = "ON"
objOutputChartFormat.values = "ON"
objOutputChartFormat.legend = "OFF"

objLogQuery.ExecuteBatch strSQL, objInputW3CFormat, objOutputChartFormat
Ugly Charts
Using some of the log files from one of my websites, the above samples created the following basic chart:
Taking a look at this chart makes it easy to see why you would want to customize your output; that light blue is pretty awful, and those values are pretty hard to read.
Specifying Configuration Scripts
If you remember the incredibly basic configuration script from earlier, you only need to add one parameter to each example in order to specify the configuration script:
Command-Line:
logparser.exe "
COM Interface:
Option Explicit

Dim objLogQuery, strSQL
Dim objInputW3CFormat, objOutputChartFormat

Set objLogQuery = WScript.CreateObject("MSUtil.LogQuery")
Set objInputW3CFormat = WScript.CreateObject("MSUtil.LogQuery.W3CInputFormat")
Set objOutputChartFormat = WScript.CreateObject("MSUtil.LogQuery.ChartOutputFormat")

strSQL = "SELECT Date, COUNT(*) AS Hits " & _
    " INTO HitsByDay.gif " & _
    " FROM *.log " & _
    " GROUP BY Date " & _
    " ORDER BY Date"

objOutputChartFormat.groupSize = "800x600"
objOutputChartFormat.fileType = "GIF"
objOutputChartFormat.chartType = "Area"
objOutputChartFormat.categories = "ON"
objOutputChartFormat.values = "ON"
objOutputChartFormat.legend = "OFF"
objOutputChartFormat.config = "HitsByDay.js"

objLogQuery.ExecuteBatch strSQL, objInputW3CFormat, objOutputChartFormat
Simple Output
Taking a look at the resulting chart, you can see why I mentioned earlier that the configuration script wasn't very useful; all it does is add a centered title to the bottom of the chart:
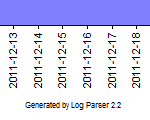
Yup - that's a pretty useless sample configuration script for chart customization.
Next...
In my subsequent posts, I'll show how to make this chart (and several other types of charts) look a lot better.
Note: This blog was originally posted at http://blogs.msdn.com/robert_mcmurray/


