In Part 2 of this series, I'll show you how to customize the area chart from Part 1 to show the chart area with a gradient. More specifically, there are three different chart gradient methods that we'll take a look at in this blog post:
Before I continue, there is one quick Log Parser convention that you should realize: there are two objects that Log Parser will create and pass to your script. As you look at the sample scripts in this post, you will see these objects in use:
| Object Name | Description | Example |
|---|
chartSpace |
This is the base chart workspace object. |
// Set the border style for the chart.
chartSpace.Border.Color = "#000000";
chartSpace.Border.Weight = 2;
|
chart |
This is equivalent to the chartSpace.Charts(0) object. |
// Change the background color.
chart.PlotArea.Interior.Color = "#ffffff";
|
Before I get started, here's a quick review of VBScript that uses Log Parser COM objects:
Option Explicit

' Declare the variables.
Dim objLogQuery, strSQL
Dim objInputW3CFormat, objOutputChartFormat

' Create the Log Parser objects.
Set objLogQuery = WScript.CreateObject("MSUtil.LogQuery")
Set objInputW3CFormat = WScript.CreateObject("MSUtil.LogQuery.W3CInputFormat")
Set objOutputChartFormat = WScript.CreateObject("MSUtil.LogQuery.ChartOutputFormat")

' Define the SQL query.
strSQL = "SELECT Date, COUNT(*) AS Hits " & _
    " INTO _Part2.gif " & _
    " FROM *.log " & _
    " GROUP BY Date " & _
    " ORDER BY Date"

' Specify the chart options.
objOutputChartFormat.groupSize = "800x600"
objOutputChartFormat.fileType = "GIF"
objOutputChartFormat.chartType = "Area"
objOutputChartFormat.categories = "ON"
objOutputChartFormat.values = "ON"
objOutputChartFormat.legend = "OFF"

' Execute the SQL statement to create the chart.
objLogQuery.ExecuteBatch strSQL, objInputW3CFormat, objOutputChartFormat
As I mentioned in Part 1 of this series, you don't have to use the COM objects, but I chose to do so for this blog series because it makes it a little easier to script. That being said, if I use one month's worth of log files from one of my low-volume websites, Log Parser and this VBScript creates the following rather ugly daily hits chart:
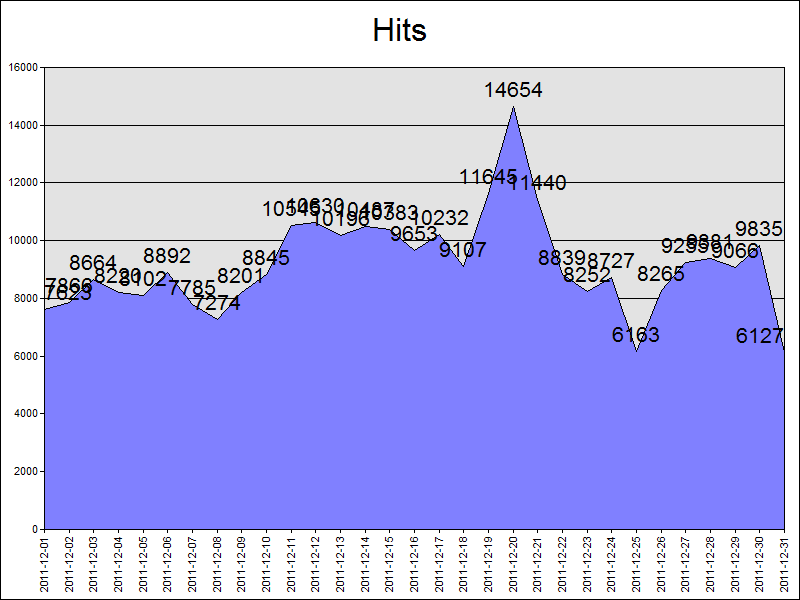
With all of this in mind, let's take a look at some simple configuration scripts.
Setting Fonts and Titles and Such...
The above chart really needs some help, so the first thing that we'll do is change a few things. First things first, we need to specify the name of the chart configuration script in the VBScript sample:
Option Explicit

' Declare the variables.
Dim objLogQuery, strSQL
Dim objInputW3CFormat, objOutputChartFormat

' Create the Log Parser objects.
Set objLogQuery = WScript.CreateObject("MSUtil.LogQuery")
Set objInputW3CFormat = WScript.CreateObject("MSUtil.LogQuery.W3CInputFormat")
Set objOutputChartFormat = WScript.CreateObject("MSUtil.LogQuery.ChartOutputFormat")

' Define the SQL query.
strSQL = "SELECT Date, COUNT(*) AS Hits " & _
    " INTO Part2.gif " & _
    " FROM *.log " & _
    " GROUP BY Date " & _
    " ORDER BY Date"

' Specify the chart options.
objOutputChartFormat.groupSize = "800x600"
objOutputChartFormat.fileType = "GIF"
objOutputChartFormat.chartType = "Area"
objOutputChartFormat.categories = "ON"
objOutputChartFormat.values = "ON"
objOutputChartFormat.legend = "OFF"
objOutputChartFormat.config = "Part2.js"

' Execute the SQL statement to create the chart.
objLogQuery.ExecuteBatch strSQL, objInputW3CFormat, objOutputChartFormat
Next, we need to create the actual chart configuration script, which I wrote in JavaScript; you will need to save this as "Part2.js" in order to use my samples:
// Set the title above the chart.
chart.HasTitle = true;
chart.Title.Caption = "Hits by Day"

// Set the border style for the chart.
chartSpace.Border.Color = "#000000";
chartSpace.Border.Weight = 2;

// Change the background color for the plot area.
chart.PlotArea.Interior.Color = "#f0f0f0";

// Set the font size for the chart values.
chart.SeriesCollection(0).DataLabelsCollection(0).Font.Size = 6;

// Get the start and end dates from the X axis.
var startDate = chart.Axes(0).CategoryLabels.Item(0).Caption;
var endDate = chart.Axes(0).CategoryLabels.Item(chart.Axes(0).CategoryLabels.ItemCount-1).Caption;

// Set the caption below the chart.
chartSpace.HasChartSpaceTitle = true;
chartSpace.ChartSpaceTitle.Caption =
    "This chart shows the hits by day from "
    + startDate + " to " + endDate + ".";
chartSpace.ChartSpaceTitle.Font.Size = 10;
chartSpace.ChartSpaceTitle.Position = chartSpace.Constants.chTitlePositionBottom;

// Set the style and caption for the Y axis.
chart.Axes(0).Font.Size = 8;
chart.Axes(0).HasTitle = true;
chart.Axes(0).Title.Caption = "Dates";
chart.Axes(0).Title.Font.Size = 9;

// Set the style and caption for the X axis.
chart.Axes(1).Font.Size = 7;
chart.Axes(1).HasTitle = true;
chart.Axes(1).Title.Caption = "Hits";
chart.Axes(1).Title.Font.Size = 9;
This chart configuration script does several things:
- Sets the title above the chart to "Hits by Day"
- Sets a black border style for the chart
- Sets the background color for the plot area to a light gray
- Sets the font size for the chart values to 6-point
- Sets the caption below the chart for the start and end date
- Sets the font styles and captions for the Y and Y axes
When you run the VBScript, the resulting chart looks like the following:
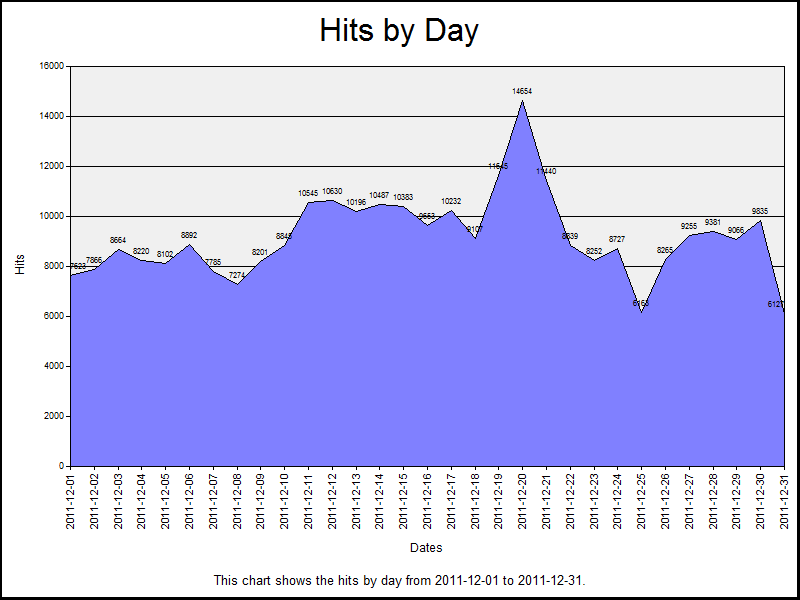
This looks a little more legible, but now let's look at setting some colors.
Setting a One-Color Gradient
Using the same JavaScript sample from earlier, we just need to make a couple of changes to the chart configuration script in order to use the SetOneColorGradient method:
// Set the title above the chart.
chart.HasTitle = true;
chart.Title.Caption = "Hits by Day"

// Set the border style for the chart.
chartSpace.Border.Color = "#000000";
chartSpace.Border.Weight = 2;

// Change the background color for the plot area.
chart.PlotArea.Interior.Color = "#f0f0f0";

// Specify the chart gradient styles.
chart.SeriesCollection(0).Interior.SetOneColorGradient(
 chartSpace.Constants.chGradientHorizontal,
 chartSpace.Constants.chGradientVariantEnd,
 1.0,
 "#ff0000");

// Set the font size for the chart values.
chart.SeriesCollection(0).DataLabelsCollection(0).Font.Size = 6;

// Get the start and end dates from the X axis.
var startDate = chart.Axes(0).CategoryLabels.Item(0).Caption;
var endDate = chart.Axes(0).CategoryLabels.Item(chart.Axes(0).CategoryLabels.ItemCount-1).Caption;

// Set the caption below the chart.
chartSpace.HasChartSpaceTitle = true;
chartSpace.ChartSpaceTitle.Caption =
    "This chart shows the hits by day from "
    + startDate + " to " + endDate + ".";
chartSpace.ChartSpaceTitle.Font.Size = 10;
chartSpace.ChartSpaceTitle.Position = chartSpace.Constants.chTitlePositionBottom;

// Set the style and caption for the Y axis.
chart.Axes(0).Font.Size = 8;
chart.Axes(0).HasTitle = true;
chart.Axes(0).Title.Caption = "Dates";
chart.Axes(0).Title.Font.Size = 9;

// Set the style and caption for the X axis.
chart.Axes(1).Font.Size = 7;
chart.Axes(1).HasTitle = true;
chart.Axes(1).Title.Caption = "Hits";
chart.Axes(1).Title.Font.Size = 9;
When you run the VBScript, this renders a chart that looks like the following:
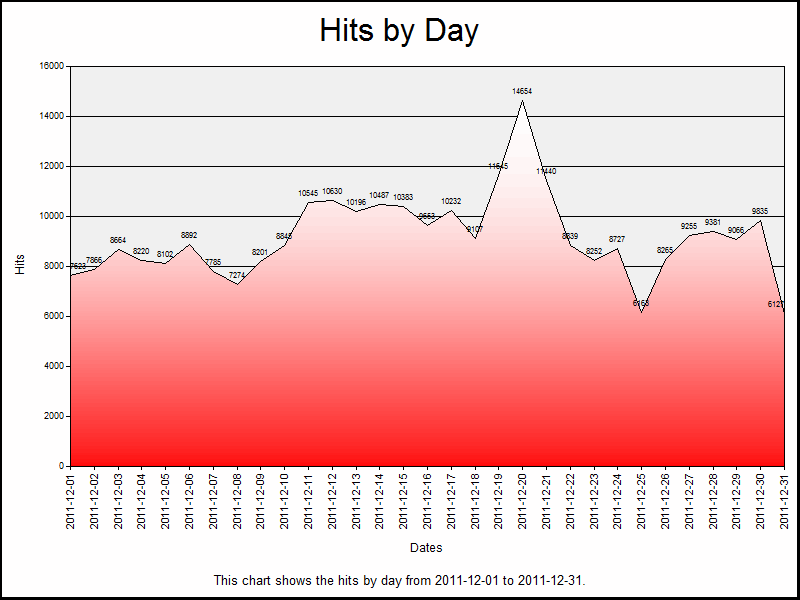
There are four parameters for the SetOneColorGradient method to look at:
| Parameter | Description |
|---|
GradientStyle |
This is a value from the ChartGradientStyleEnum enumeration, which specifies how the gradient will be displayed. For example: horizontally, vertically, diagonally, etc. |
GradientVariant |
This is a value from the ChartGradientVariantEnum enumeration, which specifies which direction the gradient will be displayed. For example: lighter to darker, from the inside to the outside, etc. |
GradientDegree |
This is a double value from 0.0 to 1.0, which specifies whether the gradient will range from the color to lighter or darker shades. |
Color |
This is a string that specifies the color. This can be a commonly-named color, such as "red," "blue," etc., or this can be an RGB hexadecimal value, such as "#ff0000" (red), "#0000ff" (blue), etc. (See my 216-Color Safe Web Palette blog post for a large series of hexadecimal color values.) |
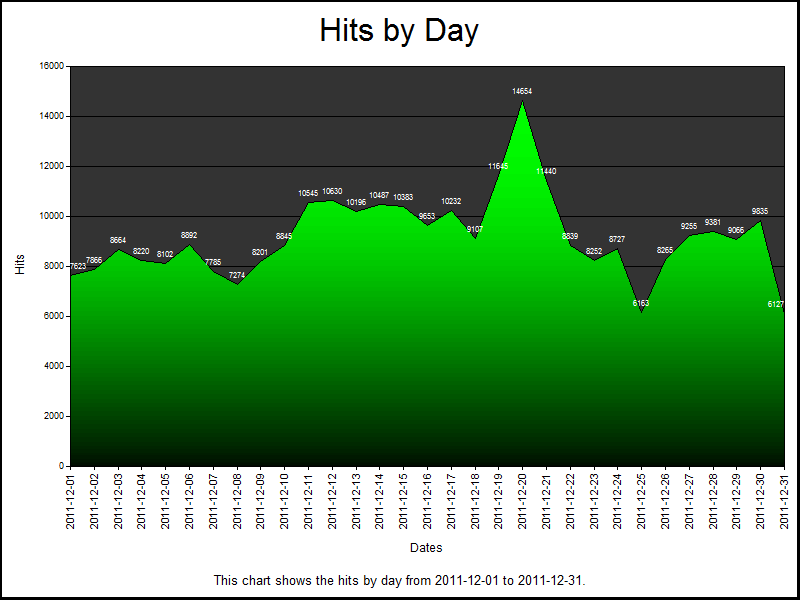
Let's make some quick changes to parameters that we are passing to the SetOneColorGradient method and alter a few of the colors:
// Set the title above the chart.
chart.HasTitle = true;
chart.Title.Caption = "Hits by Day"

// Set the border style for the chart.
chartSpace.Border.Color = "#000000";
chartSpace.Border.Weight = 2;

// Change the background color for the plot area.
chart.PlotArea.Interior.Color = "#333333";

// Specify the chart gradient styles.
chart.SeriesCollection(0).Interior.SetOneColorGradient(
    chartSpace.Constants.chGradientHorizontal,
    chartSpace.Constants.chGradientVariantStart,
    0.0,
    "#00ff00");

// Set the font size for the chart values.
chart.SeriesCollection(0).DataLabelsCollection(0).Font.Size = 6;
chart.SeriesCollection(0).DataLabelsCollection(0).Font.Color = "#ffffff";

// Get the start and end dates from the X axis.
var startDate = chart.Axes(0).CategoryLabels.Item(0).Caption;
var endDate = chart.Axes(0).CategoryLabels.Item(chart.Axes(0).CategoryLabels.ItemCount-1).Caption;

// Set the caption below the chart.
chartSpace.HasChartSpaceTitle = true;
chartSpace.ChartSpaceTitle.Caption =
    "This chart shows the hits by day from "
    + startDate + " to " + endDate + ".";
chartSpace.ChartSpaceTitle.Font.Size = 10;
chartSpace.ChartSpaceTitle.Position = chartSpace.Constants.chTitlePositionBottom;

// Set the style and caption for the Y axis.
chart.Axes(0).Font.Size = 8;
chart.Axes(0).HasTitle = true;
chart.Axes(0).Title.Caption = "Dates";
chart.Axes(0).Title.Font.Size = 9;

// Set the style and caption for the X axis.
chart.Axes(1).Font.Size = 7;
chart.Axes(1).HasTitle = true;
chart.Axes(1).Title.Caption = "Hits";
chart.Axes(1).Title.Font.Size = 9;
When you run the VBScript, that results in the following considerably cooler-looking chart:
Setting a Two-Color Gradient
The SetTwoColorGradient method offers more color flexibility than the one-color gradient method, and we only need to make a couple of changes to the JavaScript for the chart configuration script in order to use the new method:
// Set the title above the chart.
chart.HasTitle = true;
chart.Title.Caption = "Hits by Day"

// Set the border style for the chart.
chartSpace.Border.Color = "#000000";
chartSpace.Border.Weight = 2;

// Change the background color for the plot area.
chart.PlotArea.Interior.Color = "#FFFF99";

// Specify the chart gradient styles.
chart.SeriesCollection(0).Interior.SetTwoColorGradient(
 chartSpace.Constants.chGradientVertical,
 chartSpace.Constants.chGradientVariantStart,
 "#0066FF",
 "#00FFCC");

// Set the font size for the chart values.
chart.SeriesCollection(0).DataLabelsCollection(0).Font.Size = 6;

// Get the start and end dates from the X axis.
var startDate = chart.Axes(0).CategoryLabels.Item(0).Caption;
var endDate = chart.Axes(0).CategoryLabels.Item(chart.Axes(0).CategoryLabels.ItemCount-1).Caption;

// Set the caption below the chart.
chartSpace.HasChartSpaceTitle = true;
chartSpace.ChartSpaceTitle.Caption =
    "This chart shows the hits by day from "
    + startDate + " to " + endDate + ".";
chartSpace.ChartSpaceTitle.Font.Size = 10;
chartSpace.ChartSpaceTitle.Position = chartSpace.Constants.chTitlePositionBottom;

// Set the style and caption for the Y axis.
chart.Axes(0).Font.Size = 8;
chart.Axes(0).HasTitle = true;
chart.Axes(0).Title.Caption = "Dates";
chart.Axes(0).Title.Font.Size = 9;

// Set the style and caption for the X axis.
chart.Axes(1).Font.Size = 7;
chart.Axes(1).HasTitle = true;
chart.Axes(1).Title.Caption = "Hits";
chart.Axes(1).Title.Font.Size = 9;
When you run the VBScript, this will create the following chart:
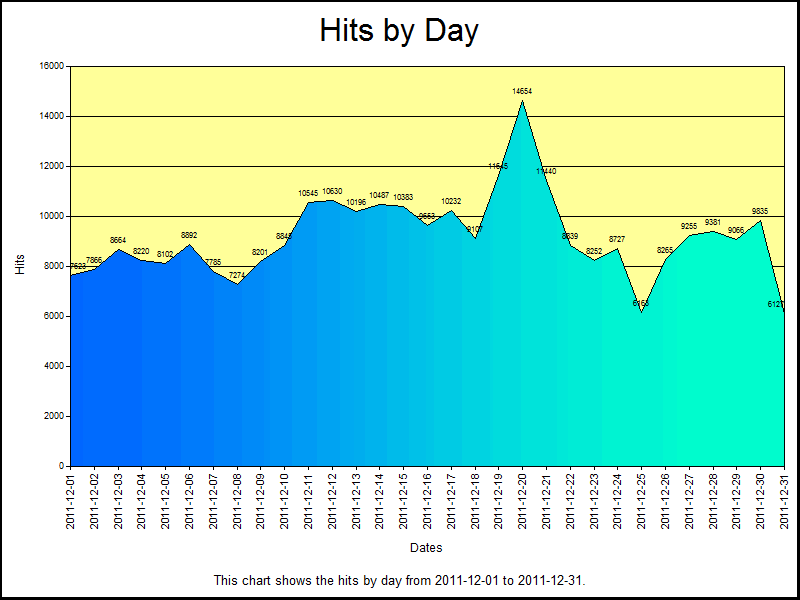
There are four parameters for the SetTwoColorGradient method to consider:
| Parameter | Description |
|---|
GradientStyle |
This is a value from the ChartGradientStyleEnum enumeration, which specifies how the gradient will be displayed. For example: horizontally, vertically, diagonally, etc. |
GradientVariant |
This is a value from the ChartGradientVariantEnum enumeration, which specifies which direction the gradient will be displayed. For example: lighter to darker, from the inside to the outside, etc. |
Color |
This is a string that specifies the first color for the gradient; this can be a commonly-named color, such as "red," "blue," etc., or this can be an RGB hexadecimal value, such as "#ff0000" (red), "#0000ff" (blue), etc. (See my 216-Color Safe Web Palette blog post for a large series of hexadecimal color values.) |
BackColor |
This is a string that specifies the second color for the gradient; this can be a value like the Color parameter. |
Using a Preset Gradient
There is an additional gradient method that uses a collection of preset color palettes; this method is appropriately named SetPresetGradient. Once again, we need to make a couple of changes to the JavaScript for the chart configuration script in order to use the new method:
// Set the title above the chart.
chart.HasTitle = true;
chart.Title.Caption = "Hits by Day"

// Set the border style for the chart.
chartSpace.Border.Color = "#000000";
chartSpace.Border.Weight = 2;

// Change the background color for the plot area.
chart.PlotArea.Interior.Color = "#EEFFDD";

// Specify the chart gradient styles.
chart.SeriesCollection(0).Interior.SetPresetGradient(
 chartSpace.Constants.chGradientHorizontal,
 chartSpace.Constants.chGradientVariantStart,
 chartSpace.Constants.chGradientFire);

// Set the font size for the chart values.
chart.SeriesCollection(0).DataLabelsCollection(0).Font.Size = 6;

// Get the start and end dates from the X axis.
var startDate = chart.Axes(0).CategoryLabels.Item(0).Caption;
var endDate = chart.Axes(0).CategoryLabels.Item(chart.Axes(0).CategoryLabels.ItemCount-1).Caption;

// Set the caption below the chart.
chartSpace.HasChartSpaceTitle = true;
chartSpace.ChartSpaceTitle.Caption =
    "This chart shows the hits by day from "
    + startDate + " to " + endDate + ".";
chartSpace.ChartSpaceTitle.Font.Size = 10;
chartSpace.ChartSpaceTitle.Position = chartSpace.Constants.chTitlePositionBottom;

// Set the style and caption for the Y axis.
chart.Axes(0).Font.Size = 8;
chart.Axes(0).HasTitle = true;
chart.Axes(0).Title.Caption = "Dates";
chart.Axes(0).Title.Font.Size = 9;

// Set the style and caption for the X axis.
chart.Axes(1).Font.Size = 7;
chart.Axes(1).HasTitle = true;
chart.Axes(1).Title.Caption = "Hits";
chart.Axes(1).Title.Font.Size = 9;
When you run the VBScript, this will create the following chart:
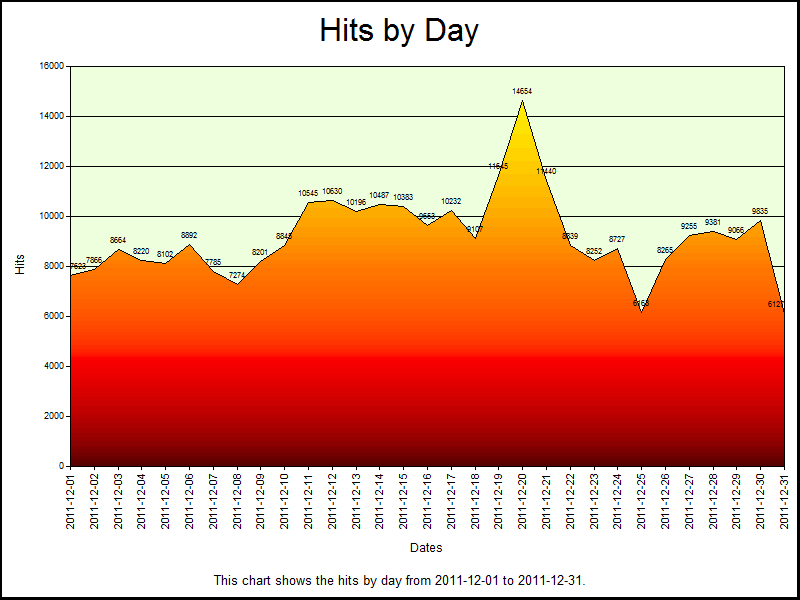
There are three parameters for the SetPresetGradient method to look at:
| Parameter | Description |
|---|
GradientStyle |
This is a value from the ChartGradientStyleEnum enumeration, which specifies how the gradient will be displayed. For example: horizontally, vertically, diagonally, etc. |
GradientVariant |
This is a value from the ChartGradientVariantEnum enumeration, which specifies which direction the gradient will be displayed. For example: lighter to darker, from the inside to the outside, etc. |
GradientPreset |
This is a value from the ChartPresetGradientTypeEnum enumeration, which specifies the gradient preset palette. |
There are several of preset gradients in the ChartPresetGradientTypeEnum enumeration, and a little experimentation will yield the best results.
Using 3-D Area Charts
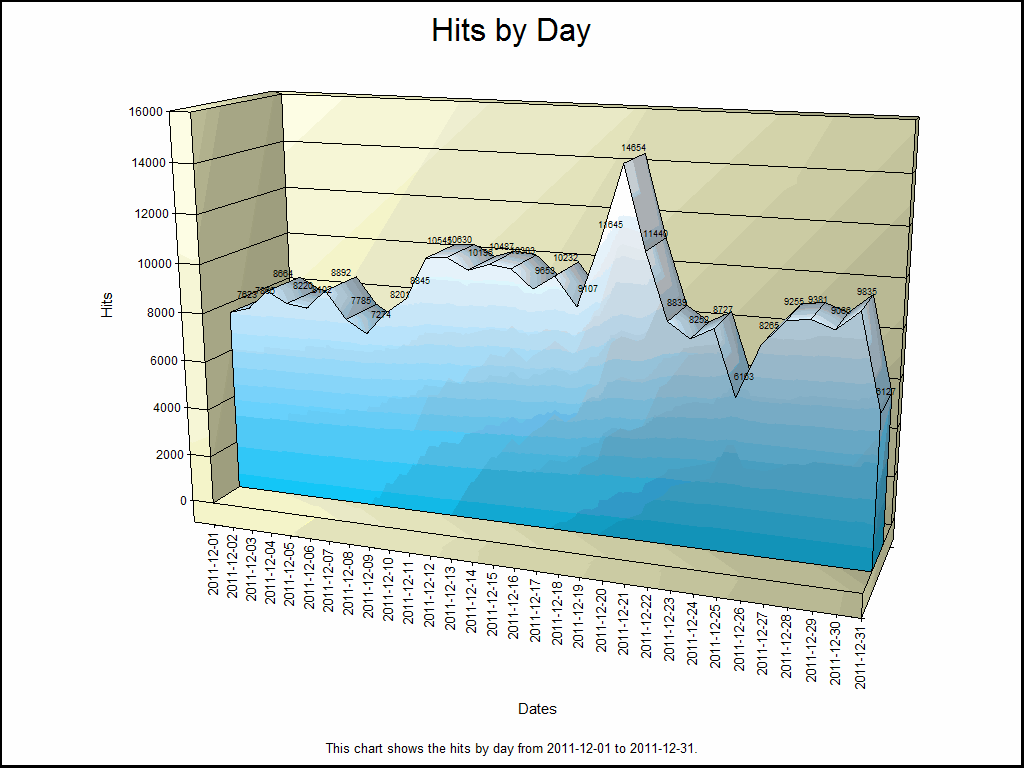
For one last sample, I'd like to show you what gradients can do for your 3-D area charts. To do so, we first need to make a couple of small changes the VBScript that will create the chart:
Option Explicit

' Declare the variables.
Dim objLogQuery, strSQL
Dim objInputW3CFormat, objOutputChartFormat

' Create the Log Parser objects.
Set objLogQuery = WScript.CreateObject("MSUtil.LogQuery")
Set objInputW3CFormat = WScript.CreateObject("MSUtil.LogQuery.W3CInputFormat")
Set objOutputChartFormat = WScript.CreateObject("MSUtil.LogQuery.ChartOutputFormat")

' Define the SQL query.
strSQL = "SELECT Date, COUNT(*) AS Hits " & _
    " INTO _Part2.gif " & _
    " FROM *.log " & _
    " GROUP BY Date " & _
    " ORDER BY Date"

' Specify the chart options.
objOutputChartFormat.groupSize = "1024x768"
objOutputChartFormat.fileType = "GIF"
objOutputChartFormat.chartType = "Area3D"
objOutputChartFormat.categories = "ON"
objOutputChartFormat.values = "ON"
objOutputChartFormat.legend = "OFF"
objOutputChartFormat.config = "Part2.js"

' Execute the SQL statement to create the chart.
objLogQuery.ExecuteBatch strSQL, objInputW3CFormat, objOutputChartFormat
Next, we need to update the JavaScript for the chart configuration script to work with the new VBScript; for the most part, I'm just updating font sizes and chart colors:
// Set the title above the chart.
chart.HasTitle = true;
chart.Title.Caption = "Hits by Day"

// Clear the caption for the chart series.
chart.SeriesCollection(0).Caption = "";

// Set the border style for the chart.
chartSpace.Border.Color = "#000000";
chartSpace.Border.Weight = 2;

// Change the background color for the plot area.
chart.PlotArea.Interior.Color = "#FFFFCC";

// Specify the chart gradient styles.
chart.SeriesCollection(0).Interior.SetTwoColorGradient(
    chartSpace.Constants.chGradientHorizontal,
    chartSpace.Constants.chGradientVariantEnd,
    "#00CCFF",
    "#FFFFFF");

// Set the font size for the chart values.
chart.SeriesCollection(0).DataLabelsCollection(0).Font.Size = 7;

// Get the start and end dates from the X axis.
var startDate = chart.Axes(0).CategoryLabels.Item(0).Caption;
var endDate = chart.Axes(0).CategoryLabels.Item(chart.Axes(0).CategoryLabels.ItemCount-1).Caption;

// Set the caption below the chart.
chartSpace.HasChartSpaceTitle = true;
chartSpace.ChartSpaceTitle.Caption =
    "This chart shows the hits by day from "
    + startDate + " to " + endDate + ".";
chartSpace.ChartSpaceTitle.Font.Size = 10;
chartSpace.ChartSpaceTitle.Position = chartSpace.Constants.chTitlePositionBottom;

// Set the style and caption for the Y axis.
chart.Axes(0).Font.Size = 10;
chart.Axes(0).HasTitle = true;
chart.Axes(0).Title.Caption = "Dates";
chart.Axes(0).Title.Font.Size = 11;

// Set the style and caption for the X axis.
chart.Axes(1).Font.Size = 9;
chart.Axes(1).HasTitle = true;
chart.Axes(1).Title.Caption = "Hits";
chart.Axes(1).Title.Font.Size = 11;
When you run the VBScript, this will create the following chart:
Summary
In this blog post, I've written a lot of code samples in order to show you four different ways to set gradients for your Log Parser area charts. In future posts, I'll show you how to do some more cool things with some other types of charts.
;-]
Note: This blog was originally posted at http://blogs.msdn.com/robert_mcmurray/